What is inflation? As one of my old Economics professors said simply, “Inflation is too many dollars chasing too few goods.” Another way to say, an increase in purchase prices and a decrease in the value of money and purchasing power.
We can talk about the reasons for the current inflationary situation another time, but suffice it to say, there are plenty of reasons, and plenty of blame to go around. Regardless, we are where we are, so let’s talk about how real estate performs relative to inflation, and what property types perform better in a high inflation environment.
Rising inflation favors property types with a shorter than average lease terms, like multifamily, single-family rentals, self-storage, and hotels (which effectively lease up daily) because landlords can effectively recoup increased costs from increased rents in the short-term.
Alternatively, properties with longer lease terms, like office, retail, and some industrial deals will be subject to whatever terms are remaining on their leases of 5, 10, 15 or even 20 years.
Those leases could be flat or have annual rent bumps growing at 2-3%, which would have been plenty to offset any increases in operating costs until inflation began spiking since early 2021.
Those rent bumps were meant to offset potential losses from increases in operating expenses, but in a high inflationary environment, like what we are experiencing today, those base rent increases are insufficient to cover those much higher costs. So, those properties are seeing the erosion of their net operating income, and therefore their value.
Those properties with longer lease terms should also be able to command higher rents, once tenants renew or new tenants are installed at higher rates, but it will take longer for them to appreciate.
The exception to the rule of real estate being a hedge against inflation, occurs during periods of stagflation, which used to be a theoretical concept until it actually happened in the 1970s. That is where you have high inflation and very low or negative growth.
In those cases, landlords are unable to capitalize on rent growth, which is either muted or nonexistent, and they get hit with the double whammy of higher costs and greater vacancy.
We can discuss inflation and stagflation more next time.
Converting office buildings to residential use is not a new concept in New York city real estate. However, the idea is re-emerging as a way to counter pandemic-related market shifts. There is an imbalance in the New York City real estate market. We have an oversupply of arguably obsolete office space and a drastic undersupply of reasonably priced residential real estate.
This situation has existed for some time now and the trend towards remote work resulting from the pandemic has had a significant negative impact on office fundamentals, making the imbalance worse.
For example, Yelp recently announced that it was leaving offices in 3 major US cities including two locations totaling 270,000 SF in Manhattan. In announcing the decision, Yelp’s CEO cited an employee survey that found that 86% of their workers preferred to work remotely. And explained that when they reopened these offices, utilization was less than 2%.
From 1995 to 2006, a tax incentive program known as 421g enacted for Lower Manhattan enabled more than 15 million square feet of conversions from office to residential use. Under this program, the owner received several substantial property tax benefits.
Residential conversions have also been completed successfully in other markets. In 2021 alone, 151 commercial properties across the country were converted to apartment buildings.
So what are the prospects for future conversions in New York City?
Manhattan currently has 37 office buildings exceeding 100,000 SF where at least half the building is listed for lease and this only accounts for the publicly listed available space. Many of these distressed office buildings are encumbered with large mortgages. On the surface, there is no shortage of conversion candidates.
A well-executed residential conversion generally costs far less than new ground-up multifamily construction. However, there are some significant challenges to executing this strategy.
Possibly the biggest physical obstacle is that many office buildings have large floor plates that lack accessible light and air in the interior. One possible solution is to use the interior of the building for storage, home offices or other amenities that do not require windows.
Zoning is another big obstacle. Many of the city’s office buildings are located in areas zoned only for commercial uses. Earlier this year, NY State Governor Hochul proposed zoning changes that would make office-to-residential conversions much easier. However, these proposed changes were rejected by the State Legislature.
It was recently announced that 55 Broad Street, a landmarked 425,000 sf, 30 story building in the Financial District was sold and will be converted to 571 apartments. The sale price was $180 million, which equates to $425 PSF. This price is substantially lower than most other Manhattan office buildings that are currently listed for sale.
This imbalance is a big problem with no easy solution. To the extent that mortgages on these buildings are underwater, these loans may need to be sold. It will be interesting to see how this situation evolves over time.
Up, down or sideways? What’s happening in Manhattan’s world famous SoHo neighborhood? Are rents going down? Watch to learn about the trends we see developing right now in the high-end boutique leasing market. Share this with anyone who follows Manhattan real estate.
Real estate nerds like me love a great site tour. And there are no better sites to tour than High Street retail in markets like San Francisco, Santa Monica and New York City. While Manhattan sub-market rents in Meatpacking and Bleecker Street appear to be permanently lower, one market that is demonstrating resilience is the Soho District of Manhattan. The key high-end boutique corridor in SoHo is Mercer Street, home to the Mercer Hotel, the Fanelli Cafe, & many cutting edge boutiques.
Last dollar psf debt loads on certain retail condominiums in Soho have approached $4000 to $5000 per square foot. Because of this, we have seen a number of sub and non-performing loans secured by retail condominiums trade in the secondary market, particularly cash out refinance loans predicated on rents between $500 psf and $750 psf.
We walked on Mercer Street corridor to figure out what is fantasy and what is reality in the post Covid leasing market.
In addition to following reported leases, one way to read the tea leaves is to read the construction permits posted on the front of buildings undergoing retail tenant improvements.
Recent leasing activity includes Softbank-backed Vuori, a take on LuluLemon, with 6,000 sf at 95 Mercer and a new build out of an existing boutique by Tory Burch. Additionally, we were able to identify at least four more spaces that have been leased and are under construction totaling nearly 22,000 sf.
49 Mercer- 7,750sf – signed July 2021 -no rent or tenant listed
53 Mercer- 6,100sf – signed sep 2021 – $225 PSF – F.P Journe – 10 years
77 Mercer- 5,100sf – signed December 2021 – no rent or tenant listed
149 Mercer- 3,600sf – Signed Feb 2022 – no rent or tenant listed
These include 49 Mercer, 53 Mercer, 77 Mercer, 149 Mercer.
The reported rents on these new leases range from around $250 per square foot to north of $500 per square foot.
At the same time however, we noted signs advertising active pop-up retail leasing opportunities.
Retail is very block-specific in Soho so it remains to be seen whether the consensus rent in the $250 per square foot range becomes the norm or if key spaces continue to touch $500 psf. One factor is clear, basements don’t necessarily count anymore toward the headline rent per square foot figure.
Look for our compare and contrast analysis of occupancy on a block-by-block store-by-store basis from summer 2021 to summer 2022. We will try to figure out the macro trends in this micromarket.
Mission Capital Advisors Acquired by Marcus & Millichap
Posted Friday, November 20, 2020.
David Tobin, Principal of Mission Capital, discusses what our clients should expect from Mission Capital Advisors now that the company has been acquired by Marcus & Millichap. Hint: it’s good.
Memory Care & Assisted Living Facilities In Loan Portfolio Sales with David Tobin | Principal [Video]
David Tobin, Principal, chats about loan portfolios secured by memory care and assisted living facilities.
In light of the recent termination of Silverado by the Welltower REIT of 20 properties that are standalone memory care facilities, it’s incumbent upon regional, super regional and large community banks to examine their memory care and assisted living loan portfolios and understand the risk embedded in those deals.
In particular, standalone, private-pay, assisted-living and memory care facilities in over-billed markets are particularly prone to default and credit stress. One of the factors contributing to this is the fact that Baby Boom has not caught up with the demand for memory care services as the height peak Baby Boom population is moving through its early to mid-sixties, and memory care demand does not occur until late seventies and early eighties.
Banks should take this opportunity and a highly liquid marketplace to shed assets, which have a higher propensity to default or which have already defaulted. The opportunity to exit portfolios of assisted living and memory care assets is in the marketplace today, and an opportunity may not exist tomorrow.
William David Tobin is one of two founders of Mission Capital and a founder of EquityMultiple, an on-line loan and real estate equity syndication platform seed funded by Mission Capital. He has extensive transactional experience in loan sale advisory, real estate investment sales and commercial real estate debt and equity raising. In addition, Mr. Tobin is Chief Compliance Officer for Mission Capital.
Under Mr. Tobin’s guidance and supervision, Mission has been awarded and continues to execute prime contractor FDIC contracts for Whole Loan Internet Marketing & Support (loan sales), Structured Sales (loan sales) and Financial Advisory Valuation Services (failing bank and loss share loan portfolio valuation), Federal Reserve Bank of New York (loan sales), Freddie Mac (programmatic bulk loan sales for FHFA mandated deleveraging), multiple ongoing Federal Home Loan Bank valuation contracts and advisory assignments with the National Credit Union Administration.
BACKGROUND
From 1992 to 1994, Mr. Tobin worked as an asset manager in the Asset Resolution Department of Dime Bancorp (under OTS supervision) where he played an integral role in the liquidation of the $1.2 billion non-performing single-family loan and REO portfolio. The Dime disposition program included a multi-year asset-by-asset sellout culminating in a $300 million bulk offering to many of the major portfolio investors in the whole loan investment arena. From 1994 to 2002, Mr. Tobin was associated with a national brokerage firm, where he started and ran a loan sale advisory business, heading all business execution and development.
Mr. Tobin has a B.A. in English Literature from Syracuse University and attended the MBA program, concentrating in banking and finance, at NYU’s Stern School of Business. He has lectured on the topics of whole loan valuation and mortgage trading at New York University’s Real Estate School. Mr. Tobin is a member of the board of directors of H Bancorp (www.h-bancorp.com), a $1.5 billion multi-bank holding company that acquires and operates community banks throughout the United States. Mr. Tobin is a member of the Real Estate Advisory Board of the Whitman School of Management at Syracuse University and a board member of A&M Sports / Clean Hands for Haiti.
By Steve ‘Buch’ Buchwald – The Debt & Equity Finance Group
(Steve ‘Buch’ Buchwald, New York, 3/25/2019) — In my previous article on Historic Tax Credits, we discussed one complicated financing structure commonly used by developers to capitalize their deals. In this article, we will discuss PACE Financing. I will do an article on several of these – a quick list includes Historic Tax Credits, PACE Financing, EB-5, and Ground Leases. Each of these specialty finance products adds layers of inflexibility to recoup equity, make refinancing decisions, account of cost overruns, and exit or refinance at attractive terms. My next article will be about EB-5, which was similarly popular a few years ago and now many developers regret the decision to take such an inflexible, difficult to deal with piece of capital just to save a few hundred basis points during construction on a small piece of the capital stack.
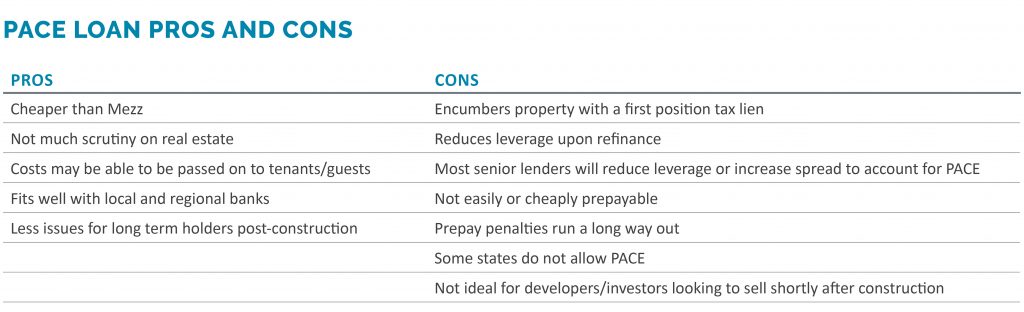
If you are in the commercial real estate development or financing business, I would be surprised if the term PACE Financing hasn’t crossed your desk by now. So…what is PACE? PACE stands for “Property Assessed Clean Energy”. Putting aside the minutiae of energy efficiency and what costs qualify, the key components to address are whether to employ PACE, where it lies in the capital stack, its security and repayment terms.
Before we explore what PACE really is, let me first address how it is pitched. PACE lenders have hired some amazing sales people and put out some extremely compelling materials about their programs. These materials paint a rosy picture – at the end of this article I will address how their materials could present a more balanced view – but borrowers are often drawn to low interest rate financing alternatives regardless of the potential costs and penalties down the road or across the rest of the capital stack. Like all new forms of financing, developers should be discerning and cautious. Low interest rate financing alternatives that look attractive on paper can have unintended consequences as the project progresses, particularly when it needs to be refinanced, recapitalized, or sold.
So how is PACE pitched? It is pitched as a long-term, low cost mezz alternative. Why pay 12% for mezzanine debt or preferred equity when you can get PACE for 7% fixed? However, looking behind the curtains, PACE cannot be compared to mezz in terms of security and its position within the capital stack. A PACE loan is a self-liquidating loan that is secured by a tax lien and is repaid through tax payments over a 20-year period. Like any tax lien, it is in first position, ahead of any senior lender, and it is literally on the state’s tax assessment roll. That is why some states allow PACE and some do not. But if PACE is the most senior piece of capital in the capital stack, why should it get a higher interest rate than the senior lender? Good question – it shouldn’t.
The Place PACE by Steven ‘Buch’ Buchwald, Managing Director – The Debt & Equity Finance Group
Putting PACE into your capital stack also has a potential cascade effect. If the senior is getting pushed up in effective LTV by the PACE loan, then it will either charge a higher spread on what should be a much larger piece of capital than the PACE piece would represent, effectively killing or more than killing whatever benefit it should provide over a traditional mezz loan, or it will reduce its leverage dollar for dollar at the same rate. Either way, that is not what is shown in PACE marketing materials where it looks as if the senior lender keeps its leverage the same at the same rate. Add on top of this a yield maintenance or hefty 5%+ prepay penalties that reduce in amount but go out a very long time, a reduced NOI due to the tax lien upon refinance, and other ancillary fees, one will generally find that PACE can be an expensive financing alternative, particularly as it pertains to recourse averse developers, developers with larger projects, and merchant builders or partnerships with fund LP capital that want to exit quickly.
To be clear, there is a place for PACE. If you are looking to develop a smaller scale property, desire to hold on to the property for a long time, are in a state that allows for PACE, and are employing local community or regional senior bank debt (typically partial to full recourse), then PACE may make sense. These lenders just care about their Loan to Cost and are underwriting to stabilized DSCR.
One of the perks of PACE is that the green energy aspect of it allows for a rationale to pass the tax lien on to tenants in commercial buildings through their lease or to guests at a hotel as an ancillary charge. While this does affect the end user’s effective rent or ADR, respectively, the underwriting can certainly pass muster for these local and regional bank lenders. Going back to the PACE marketing materials where the lender is pushed up in the capital stack and keeps their loan amount and rate the same – this is now a possibility – and the PACE works as intended (and marketed). It is no wonder then that almost every senior lender that has closed with PACE financing has this lender profile.
By Steve ‘Buch’ Buchwald – The Debt & Equity Finance Group
(Steve ‘Buch’ Buchwald, New York, 2/5/2019) — As it becomes more and more popular to gut renovate beautiful old buildings centrally located in various markets across the county, Historic Tax Credit transactions are becoming more common. Much to the chagrin of lenders, HTC deals have their own rules and, unfortunately, not all these transactions have identical structures. This further convolutes what is already a very complex and esoteric intricacy to commercial real estate transactions.
So, let’s back up. Historic Tax Credits can be either Federal Tax Credits, administered by the National Park Service (NPS), or State Tax Credits, administered by the state in question. These are based on qualified rehabilitation expenditures (QREs). While State Tax Credits can be relatively straight forward, the Federal Tax Credit rules often dictate complex org chart structures and create confusion among developers and lenders alike.
After a new set of IRS tax guidelines applicable to HTCs in 2014 were issued, the outright upfront sale of HTCs was prohibited and instead the tax credit investor had to become an investor in the transaction. The upfront payment was capped at 25% of the purchase price of the tax credits and the investor now had to have “skin in the game” throughout the construction period.
This resulted in two different structures:
The Single-Tier Structure – the structure whereby the tax investor is admitted as a partner of the property-owning entity and that entity is thus entitled to claim the HTCs.
The Master-Lease Structure – The property owner leases the property to an entity owned at least 99% by the tax investor. The master lessee in turn obtains a 10% stake in the property owner. While the property owner funds the QREs, it is permitted to pass the HTCs to the master lessee and thus to the tax investor through its interest in the master lessee.
If it sounds complicated, it is because it is. Even experienced lenders often balk at having to sign a subordination, non-disturbance and attornment agreement (SNDA) with the master-lease structure, claiming they will not subordinate to anyone. However, this is a must for HTC transactions since the SNDA prevents the collapse of the master lease structure upon foreclosure and, in turn, protects the tax credit investor’s rights to the HTCs. These tax credits can then be used by the investor over the five-year compliance period (20% per year) after obtaining Part 3 approval (the final NPS sign-off) post-construction. During this time, any take-out financing must also agree to sign a SNDA with the tax credit investor.
Another common point of confusion is how the HTCs can be used as a source of funding. There are generally three ways to capitalize a project with Federal HTCs:
A tax credit investor invests through the Single-Tier Structure and as a partner is entitled to the HTCs. This is straightforward as this investor would come in as a traditional LP partner. That said, this is incredibly rare and is not the standard for HTC commercial real estate transactions.
A tax credit investor purchases the HTC’s with the Master-Lease Structure and funds 25% of the HTC purchase at closing. Generally, these investors pay between 80 and 95 cents on the dollar and then 25% of this number (about 20-23% of the total HTC’s) can be used as a source of funds in the developer’s sources and uses. The remainder will typically come in over the course of the development, commonly at C of O, with some small amount held back until the developer obtains Part 3 approval from the NPS (typically 6 months or so after C of O).
With a tax credit investor structure similar to #2 above, the developer can then also obtain a tax credit bridge loan secured by the remaining payment stream from the tax credit investor that can be monetized up front. The amount of proceeds on the remaining 75% of the tax credit purchase net of the capitalized interest reserve and points on the tax credit bridge loan can then be added as an additional source of funds.
While these transactions are complicated, HTCs do significantly reduce the effective cost basis of renovation deals and thus are a necessary evil. Taking the time to properly understand the HTC structures can give developers a leg up on their competitors and lenders more deal flow and higher yields. Additionally, adding qualified professionals that understand HTCs to the development team including mortgage brokers, real estate attorneys, and tax credit consultants is a must for any developer that wants to tackle the complexities involved with Historic Tax Credit transactions.
Jillian Mariutti is director of debt and equity finance at Mission Capital Advisors.
(January 29, 2019) — The real estate development process is wrought with an array of potential landmines, and developers embarking on new projects always look for deals with enough upside to compensate for the inevitable snafus along the way. However, a reasonable expectation of upside only exists in a market where the rent-to-income ratio is not out of control.
According to the Department of Housing and Urban Development, individuals and families who spend more than 30 percent of their total household income on housing are classified as “rent-burdened.” And while these metrics are of critical importance to housing advocates and local governments seeking to provide relief to a rent-burdened population, the same numbers are extremely relevant for real estate developers. In cities such as Boulder, Colorado and Tallahassee, Florida – each of which has distinct merits – the upside for multifamily developers is muted, as each market’s median gross rent surpasses 40 percent of the city’s household income. (All figures are based on Governing.com’s metrics, sourced from the U.S. Census Bureau and 2010-2012 American Communities Survey Estimates).
Generally speaking, multifamily developers want to set their sights on cities where that metric is below 30 percent, providing an opportunity to grow rents.
What cities fall in this “sweet spot”? Not surprisingly, markets in some of the country’s fastest-growing regions. For example, Bellevue, Washington – just outside of Seattle – clocks in at a strong 23.9 percent. As the headquarters of Fortune 500 corporations such as T-Mobile and Expedia, Bellevue seems to be a veritable model of stability, where developers can have confidence that a professional workforce will retain its well-paying jobs.
Texas has a number of attractive markets, including the Dallas suburbs of Plano and Frisco, which clock in at 26.4 percent and 25.8 percent. Dallas, Houston and Austin measure in at respectable 29.2, 30 and 31 percent, respectively. The west Texas city of Odessa outperforms all of these markets, with a ratio of 25.2.
Of course, it should be noted that cities that “perform” poorly – i.e. cities with a high rent-to-income ratio – are not necessarily markets that are struggling economically. Like any ratio, the figure can climb to excessive levels based on either a high numerator or a low denominator; in other words, it changes based on either expensive housing or a weak economy. While both sets of markets indicate locales developers will likely want to avoid, they also represent a proverbial tale of two cities, with depressed Flint, Michigan (49.3) on one hand, and gateway markets like Miami (40.0) and Los Angeles (36.8) on the other. While the gateway markets may have booming economies, incomes have not kept up with the pace of housing costs, which has made those cities particularly rent-burdened.
There are a host of factors that go into the decision of where to build, but the ability to add value is one of the most important. While many seek out markets that boast a strong economy or favorable rental rates, one of these alone is not enough to assure success. But by conducting a rigorous analysis – including an assessment of the rent burden in the local market – developers can put themselves in position to reap maximum value from their efforts.
Mission Capital Advisors, a national firm, is handling the marketing of the real estate sake of the former Marsh Store, which was sold in a sheriff sale nearly a year ago to Wells Fargo Bank.
Cox Supermarkets, which had operated groceries in the city since the mid-1940s, sold the South E Street site to Marsh in 1999. The 14,730-square-foot building was home to a Marsh store until it closed in March 2017 as the regional grocery chain went under. It’s been vacant since.
The last remaining Marsh store in Richmond, ID, at 501 National Road W., is now called Needler’s, after it was bought along with several others by Ohio-based grocer Fresh Encounter.
According to online property tax records, the assessed valuation for the South E Street property is $230,500.